Which countries produce the most Wine?
The up and coming wine producers may take you by surprise!
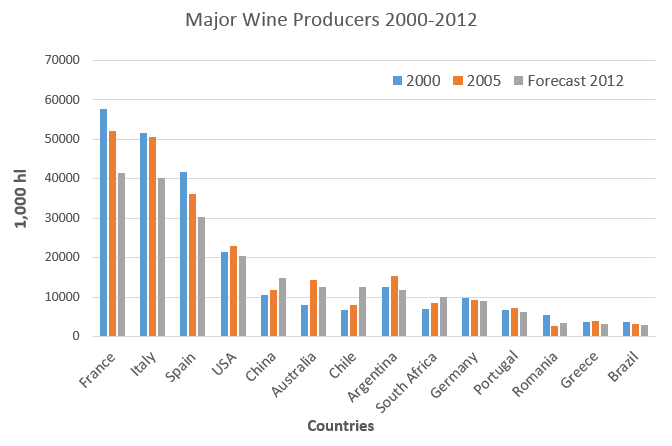
According to International Organisation of Vine and Wine in their 2013 report on World Vitiviniculture, wine consumption remains constant across the globe at 243 millions of hectolitres and wine production remains relatively unchanged at 252 millions of hectolitres. Although the wine industry appears to be static with the biggest producers still being France, Italy & Spain, there has been an interesting growth shift in the countries that produce & consume wine.

| mhl | 2000 | 2001 | 2002 | 2003 | 2004 | 2005 | 2006 | 2007 | 2008 | 2009 | 2010 | 2011 | 2012 | Change in %, 2000-20012 |
|---|---|---|---|---|---|---|---|---|---|---|---|---|---|---|
| World Total | 280,000 | 266,000 | 257,000 | 264,000 | 296,000 | 278,000 | 283,000 | 268,000 | 269,000 | 272,000 | 264,000 | 267,000 | 252,000 | -10% |
| France | 57,541 | 53,389 | 50,353 | 46,360 | 57,386 | 52,105 | 52,127 | 45,672 | 42,654 | 46,269 | 44,322 | 50,757 | 41,422 | -28% |
| Italy | 51,620 | 49,865 | 42,507 | 41,807 | 49,935 | 50,566 | 52,036 | 45,981 | 46,970 | 47,314 | 48,525 | 42,772 | 40,060 | -22% |
| Spain | 41,692 | 30,500 | 33,478 | 41,843 | 42,988 | 36,158 | 38,273 | 36,408 | 35,913 | 36,093 | 35,353 | 33,397 | 30,392 | -27% |
| USA | 21,500 | 19,200 | 20,300 | 19,500 | 20,109 | 22,888 | 19,440 | 19,870 | 19,340 | 21,965 | 20,887 | 19,187 | 20,510 | -5% |
| China | 10,500 | 10,800 | 11,200 | 11,600 | 11,700 | 11,800 | 11,900 | 12,500 | 12,600 | 12,800 | 13,000 | 13,200 | 14,880 | 42% |
| Australia | 8,064 | 10,731 | 12,168 | 10,835 | 14,679 | 14,301 | 14,263 | 9,620 | 12,448 | 11,784 | 11,420 | 11,180 | 12,660 | 57% |
| Chile | 6,674 | 5,452 | 5,623 | 6,682 | 6,301 | 7,885 | 8,448 | 8,227 | 8,683 | 10,093 | 8,844 | 10,464 | 12,554 | 88% |
| Argentina | 12,537 | 15,835 | 12,695 | 13,225 | 15,464 | 15,222 | 15,396 | 15,046 | 14,676 | 12,135 | 16,250 | 15,473 | 11,778 | -6% |
| South Africa | 6,949 | 6,471 | 7,189 | 8,853 | 9,279 | 8,406 | 9,398 | 9,783 | 10,165 | 9,986 | 9,327 | 9,324 | 10,037 | 44% |
| Germany | 9,852 | 8,891 | 9,885 | 8,191 | 10,007 | 9,153 | 8,916 | 10,261 | 9,991 | 9,228 | 6,906 | 9,132 | 9,012 | -9% |
| Portugal | 6,710 | 7,789 | 6,677 | 7,340 | 7,481 | 7,266 | 7,542 | 6,074 | 5,689 | 5,868 | 7,133 | 5,610 | 6,141 | -8% |
| Romania | 5,456 | 5,090 | 5,461 | 5,555 | 6,166 | 2,602 | 5,014 | 5,289 | 5,159 | 6,703 | 3,287 | 4,058 | 3,311 | -39% |
| Greece | 3,558 | 3,477 | 3,085 | 3,799 | 4,246 | 4,027 | 3,938 | 3,511 | 3,869 | 3,366 | 2,950 | 2,750 | 3,150 | -11% |
| Brazil | 3,638 | 2,968 | 3,212 | 2,620 | 3,925 | 3,199 | 2,372 | 3,502 | 3,683 | 2,720 | 2,459 | 3,394 | 2,917 | -20% |
Since 2000 the following countries have seen a large increase in their production of wine:
- Chile (+88%)
- Australia (+57%)
- South Africa (+44%)
- China (+42%)
On the other side, the following countries have seen the largest drops in production of wine since 2000:
- Romania (-39%)
- France (-28%)
- Spain (-27%)
- Italy (- 22%)
- Brazil (-20%)
Similarly there has been a shift in the countries that are consuming wine. The following countries have seen the largest increase in wine consumption:
- Russia (+121%)
- China (+67%)
- Canada (+60%)
- Australia (+38%)
- USA (+37%)
- UK (+29%)
The biggest decrease in consumption have been seen by the following countries:
- Romania (-50%)
- Spain (-34%)
- Italy (-27%)
From the above it is clear there have been sizeable shifts in production & consumption behaviour in an industry that has been relatively stable and consistent over the last 10+ years.
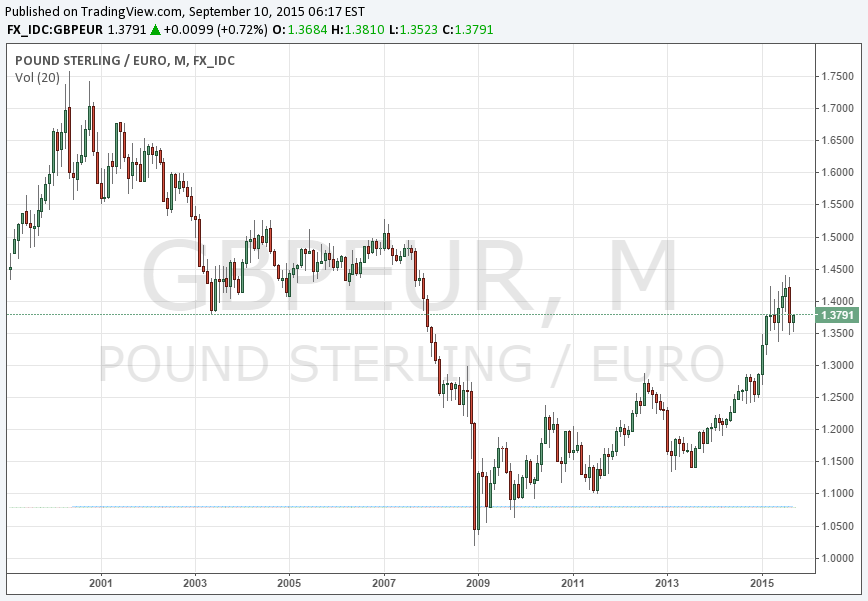
The other big change has been the currency rates over the last 10+years, just have a look at the below GBPEUR & GBPUSD chart:


With the above in mind it is important to understand how the above changes will have an effect on the costs in your business if it is importing / exporting / producing wine. e.g. Freight, Shipping, Duties, Taxes, Foreign Exchange.
Here at Mayfair FX we are committed to helping our clients steer their way around the Foreign Exchange Market to ensure they get the best deal whether they are using Banks, Currency Dealers, FX Brokers or other Foreign Exchange Providers.
We have listed 5 questions to ask your Foreign Exchange provider to help reduce your costs on Currency Transfers / International payments immediately:
- Do they charge a Commission? How much is it?
- Do they charge a Payment charge? How much is it? Are the funds sent via Swift or Bank Transfer?
- What is the FX Margin or ‘Spread’?
- Is there a Currency Converter or Money Converter you can use to check the best exchange rate they will offer you?
- When booking the money transfer do they show or tell you the Mid-market rate / Inter-bank rate?
If you or your company needs assistance finding the best solution, please do not hesitate to contact us.
Follow our twitter hashtag #GiveBackToBusiness for more usual FX tips

